 2026, Vol. 46


2. 苏州大学放射医学与防护学院 放射医学与辐射防护国家重点实验室, 苏州 215123;
3. 苏州大学公共卫生学院, 苏州 215123;
4. 盐城市射阳县疾病预防控制中心, 射阳 224300
2. State Key Laboratory of Radiation Medicine and Protection, School of Radiation Medicine and Protection, Suzhou Medical College of Soochow University, Suzhou, 215123, China;
3. School of Public Health, Suzhou Medical College of Soochow University, Suzhou 215123, China;
4. Sheyang County Center for Disease Control and Prevention, Sheyang 224300, China
计算机体层成像(computed tomography,CT)是目前最为常用的医学影像检查方法之一,在疾病诊断中发挥着重要作用[1]。研究发现CT检查频次以每年10%的速度增长,同时其所致年集体有效剂量占医学放射检查60%以上,CT所致受检者辐射剂量的迅速增加和罹患癌症的潜在风险已成为辐射防护关注的热点问题[2-5]。接受CT检查的15岁以下儿童占所有CT检查的15%~20%,生长期儿童的辐射敏感性远高于成人,同时儿童受检者配合程度较低,时有重拍的可能,导致儿童一生罹患癌症的风险远高于成人[6-8]。因此,减少儿童CT受检者的受照剂量至关重要。研究表明,合理的诊断参考水平(diagnostic reference level,DRL)能有效降低儿童受照剂量[3]。近年来国内越来越多机构通过调查来研究CT扫描受检者辐射剂量水平和本地区DRL,但辐射剂量标准与DRL均为动态变化的数值。随着成像设备的发展和技术革新、操作人员放射防护意识和知识的提升,相关标准需进行定期更新[9-12]。因此,本研究通过对盐城市儿童CT扫描受检者剂量参数的调查,对儿童CT受检者辐射剂量进行评估,为制定盐城市儿童CT扫描诊断参考水平提供理论依据。
资料与方法1.调查对象:本研究采用方便抽样方法,综合考虑被调查医疗机构的依从性,选取12家综合医疗机构(11个县市区各1家医院,并选取1家市直医院),县区覆盖率100%。共调查CT装置19台(每家医疗机构调查2台CT设备,超过2台的,随机选择2台;不足2台的全部纳入调查)。
2.调查方法和内容:回顾性收集受检者基本信息(年龄、性别、检查部位和检查日期),采集不同年龄组儿童头颅、胸部和腹部CT辐射剂量相关数据。参照国家2024年放射性危害因素监测工作方案,按扫描检查部位每台设备每个年龄组应调查20例,不足20例的按实际检查数量调查。采集CT设备信息(设备型号、出厂编号、生产厂家);CT扫描参数(管电压、管电流时间积、扫描长度、层厚、螺距等);剂量学指标:包括容积CT剂量指数(CTDIvol)、剂量长度乘积(DLP)等参数,以DLP值的第75百分位数(Q3)来表示DRL。将DRL和相应的剂量转换系数相乘,计算出每位受检者的有效剂量(E)[2]。
3.质量控制措施:调查前对调查员进行规范化的培训,统一填报口径;核对整理录入表格的数据,对于可疑数据现场调阅扫描图像进行核实,确保数据真实。
4.统计学处理:使用SPSS 24.0软件进行分析,计算中位数(M)、第25、75百分位数(Q1、Q3)等。采用独立样本非参数Kruskal-Wallis H检验比较同一检查部位不同年龄组之间的调查结果差异。采用Wilcoxon秩和检验比较同一检查部位不同医院级别间的调查结果差异。P < 0.05为差异有统计学意义。
结果1. 调查基本情况:本次共调查12家综合医疗机构(7家为三级医院、5家为二级医院)的19台CT,设备品牌包括,德国西门子公司9台、美国通用电气公司6台、日本佳能公司2台、荷兰飞利浦公司1台和上海联影医疗科技股份有限公司1台。收集2 636例儿童CT检查数据,其中头颅、胸部、腹部数量分别为994例(0~1、1~、5~和10~15岁分别为165、233、295和301例)、925例(0~1、1~、5~和10~15岁分别为112、225、288和300例)、717例(0~1、1~、5~和10~15岁分别为19、146、270和282例。病例的年龄范围为0~15岁(平均为7.21岁),三级医院(2 074例)多于二级医院(562例),男孩(1 493例)多于女孩(1 143例)。
2. CT辐射剂量调查结果:DRL指一个国家或地区内所有患者辐射剂量分布的某一百分位数对应的辐射剂量值,一般取第75百分数对应的值[12]。本次调查结果显示,儿童CT受检者4个年龄组(0~1、1~、5~和10~15岁)的CTDIvol第75百分位数值分别为:头颅33.22、41.44、51.17、48.36 mGy;胸部3.80、3.19、4.15、6.64 mGy;腹部6.58、7.08、8.42、11.86 mGy。DLP的第75百分位数值分别为:头颅522.06、641.09、906.20、831.84 mGy·cm;胸部71.72、67.35、112.72、229.28 mGy·cm;腹部167.76、226.70、301.16、522.78 mGy·cm。
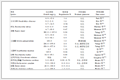
3. CT扫描参数分析:儿童CT检查不同年龄组同一检查部位管电压、管电流时间积、扫描长度和螺距的中位数不同年龄组间的差异有统计学意义(头颅、胸部和腹部,管电压:χ2=61.71、32.55、54.09,P < 0.05;管电流时间积:χ2=104.83、81.59、32.10,P < 0.05;扫描长度:χ2=120.50、536.37、211.56,P < 0.05;螺距:χ2=16.37、14.51、32.69,P < 0.05)。儿童CT扫描中使用的管电压变化相对较小,而管电流时间积变化较大,对于管电流时间积,胸部CT的管电流时间积最低,头部最高。扫描长度因检查类型的不同而不同,中位数随着年龄组的增大而增大。头部扫描所用的螺距较小,而胸部、腹部扫描所用的螺距的中位数接近或>1.0,见表 1。除头颅的管电压和螺距参数外,三级医院和二级医院同部位扫描参数间差异均具有统计学意义(头颅、胸部和腹部,管电流时间积:Z=-2.33、-5.96、-7.24,P < 0.05;扫描长度:Z=-10.55、-4.65、-11.28,P < 0.05,表 2)。
|
表 1 2024年盐城12家医疗机构不同年龄组儿童受检者不同部位CT检查主要扫描参数分析[M(Q1,Q3)] Table 1 Analysis of the primary computed tomography scanning parameters for pediatric patients across different age groups and examination regions in 12 medical institutions in Yancheng City, 2024[M(Q1, Q3)] |
|
|
表 2 2024年盐城12家医疗机构不同医院级别儿童受检者不同部位CT检查主要扫描参数分析[M(Q1,Q3)] Table 2 Analysis of the primary computed tomography scanning parameters for pediatric patients across different hospital levels and examination regions in 12 medical institutions in Yancheng City, 2024[M(Q1, Q3)] |
4. CT辐射剂量指标分析:CT辐射剂量指标分析发现,不同年龄段、不同检查部位的CTDIvol和DLP值有较大差异;同一年龄组的CTDIvol和DLP中位数,头颅最大,胸部最小;随着年龄的增长,CTDIvol和DLP中位数在各检查部位呈逐渐增大趋势。同一检查部位的不同年龄组间差异有统计学意义(头颅、胸部和腹部,CTDIvol:χ2 = 289.92、269.99、167.70,P < 0.05;DLP:χ2 = 272.34、434.91、247.16,P < 0.05,表 3)。三级医院和二级医院同部位的CTDIvol值差异均具有统计学意义(头颅、胸部和腹部,CTDIvol:Z = -5.23、-10.05、-5.25,P < 0.05),头颅CTDIvol值三级医院高于二级医院,而胸腹部则为三级医院低于二级医院。相同检查部位,三级医院的胸部DLP值低于二级医院,三级医院的头颅数值高于二级医院,两类医院的腹部数值差异无统计学意义(P>0.05),详见表 4。儿童腹部CT检查E高于头颅和胸部;不同年龄组头颅的E略高于宁夏儿童;而胸部低于宁夏儿童[13],详见表 5。
|
|
表 3 2024年盐城12家医疗机构不同年龄儿童CT受检者不同部位容积CT剂量指数和剂量长度乘积分布[M(Q1,Q3)] Table 3 Distribution of volume computed tomography dose index and dose length product values for pediatric patients across different age groups and examination regions in 12 medical institutions in Yancheng City, 2024[M(Q1, Q3)] |
|
|
表 4 2024年盐城12家医疗机构不同医院级别儿童CT受检者不同部位容积CT剂量指数和剂量长度乘积分布[M(Q1,Q3)] Table 4 Distribution of volume computed tomography dose index and dose length product values for pediatric patients across different hospital levels and examination regions in 12 medical institutions in Yancheng City, 2024[M(Q1, Q3)] |
|
|
表 5 2024年盐城12家医疗机构不同年龄组儿童不同部位CT检查有效剂量 Table 5 Effective computed tomography doses for pediatric patients across different age groups and examination regions in 12 medical institutions in Yancheng City, 2024 |
5. 与国内外相关研究结果比较:本次调查不同年龄组的头颅和腹部的CTDIvol和DLP的Q3均高于WS/T 851-2025[9] X射线计算机体层成像儿童诊断参考水平标准,但胸部的CTDIvol和DLP的Q3均低于该标准。与2024年的儿童CT检查辐射剂量标准中国专家共识比较[12],本次调查的儿童头颅、胸部、腹部的CTDIvol和DLP的值均高于全国调查的水平。与国内相关研究结果比较,除5~15岁年龄组外,本次调查,儿童头颅、及所有年龄段儿童胸腹部的CTDIvol和DLP的值低于2024年全国[14] 调查的水平;各检查部位、各年龄段的CTDIvol和DLP的值均高于2023年南京[15] 和上海[16] 调查的剂量水平;不同年龄组胸部剂量水平低于2023年天津调查水平[3]。与国外相关调查比较,头颅CTDIvol和DLP值略高于日本[17]、德国[18] 等国家以及2015年国际原子能机构(IAEA)[19] 发布的儿童CT诊断参考水平;而胸腹部的CTDIvol和DLP低于日本[17] 儿童CT诊断参考水平,与德国[18] 儿童CT诊断参考水平相当;各年龄组、各部位的值均高于伊朗[20] 的儿童CT诊断参考水平,详见表 6。
|
|
表 6 本次调查结果与国内外研究的比较 Table 6 Comparison of results in this study and those in previous investigations conducted in China and other countries |
讨论
根据放射防护最优化原则,诊断放射学实践在获得高质量图像以提供足够的临床诊断线索的同时,应保护患者免受不必要的X射线照射。因此,国际放射防护委员会(ICRP)提出了诊断参考水平[21]。在临床实践中应用DRL对于优化患者的剂量至关重要,可以确保辐射在临床成像中的安全有效使用,使受照剂量保持在合理可实现的最低水平,同时保持适当的图像质量以进行准确诊断[22-24]。因此,建立合理的CT诊断参考水平,优化扫描参数,降低CT检查辐射剂量和辐射风险,显得十分必要。但是目前国内关于儿童CT诊断参考水平研究有限,大多数是针对成人而缺乏儿童数据,配套立法也落后于欧美国家,这方面需要加强。
辐射剂量受到CT设备及检查参数的多重影响。本调查发现,各个检查部位管电流时间积和扫描长度随着年龄的增长而增加,这导致了不同年龄段个体患者之间的剂量差异。同时,三级医院和二级医院的CT扫描检查主要参数差异显著,导致二级医院的DLP值高于三级医院,这表明CT辐射剂量与CT扫描参数有一定关系。调查还发现,各个检查部位CT扫描程序的管电压范围为100~120 kV,研究表明管电压的降低能够提升图像对比度,从而减少儿童CT受检者受照剂量[22]。另外,儿童个体差异、扫描部位和CT性能等因素也影响着儿童CT受检者的受照剂量,调查结果显示,不同扫描部位的辐射剂量不同,随着年龄的增长,胸腹部的扫描长度随之增加,辐射剂量也随之增大。这些结果表明CT扫描参数影响CT辐射剂量。因此,优化盐城市儿童CT的扫描条件,特别是要降低儿童CT的管电压,对减少儿童CT受检者受照剂量显得十分重要。
本次调查发现,不同年龄段的儿童头颅的CTDIvol和DLP的典型值均高于天津[3]、南京[15]、上海[16]、伊朗[20] 的调查结果;与全国[14]、日本[17]、德国[18] 的调查结果互有高低。本调查中5~15岁儿童头颅的CTDIvol值低于全国水平,但DLP值却远高于全国调查水平,提示选取的CT扫描长度高于全国水平。儿童胸腹部的CTDIvol和DLP的典型值低于全国[14] 水平,但高于南京[15]、上海[16]、伊朗[20] 的水平。不同年龄组的儿童头颅和腹部的CTDIvol和DLP的典型值均高于WS/T 851— 2025[9],同时头颅、胸部、腹部的CTDIvol和DLP的值均高于2024年的儿童CT检查辐射剂量标准中国专家共识中调查水平[12]。另外,头颅的E略高于宁夏,而胸部的略低于宁夏[13]。以上结果提示,盐城地区儿童CT受检者的受照剂量偏大,这可能与个体差异、放射工作人员辐射防护意识等因素有关,需要进一步优化盐城市儿童CT扫描程序[3]。
本次调查存在一定的不足:①CT检查主要集中在三级医院和妇幼保健院,且未涉及一级及未定级医院,导致整体调查水平可能存在一定的偏倚。②儿童腹部CT样本量小,尤其是≤1岁儿童,二级医院部分年龄段样本量缺失较多。③未考虑儿童体重因素,且只纳入头颅、胸部和腹部等CT扫描常见部位。尽管本调查存在一些不足,DLP高于或接近国内其他省市调查水平,在国际上也处于偏高水平,但现有的调查数据依然能为建立盐城市儿童受检者CT诊断参考水平提供重要的数据支持,对了解盐城市CT诊断剂量分布、后续有效降低受检者剂量具有重要的参考意义。
利益冲突 无
作者贡献声明 陈玉中负责实验设计、实验操作、数据整理撰写论文;章益飞、董安军、周娴、王璐、朱钰、徐苗协助部分调查、数据及论文整理;孙伯超、秦立强、徐加英指导实验设计和论文修改
| [1] |
Ng CKC. Artificial intelligence for radiation dose optimization in pediatric radiology: A systematic review[J]. Children (Basel), 2022, 9(7): 1044. DOI:10.3390/children9071044 |
| [2] |
Deak PD, Smal Y, Kalender WA. Multisection CT protocols: Sex- and age-specific conversion factors used to determine effective dose from dose-length product[J]. Radiology, 2010, 257(1): 158-166. DOI:10.1148/radiol.1000047 |
| [3] |
刘春旭, 刘彦, 倪洋, 等. 天津市儿童CT检查所致受检者剂量调查与分析[J]. 中华放射医学与防护杂志, 2023, 43(12): 997-1002. Liu CX, Liu Y, Ni Y, et al. Investigation and analysis of CT dose to paediatric patients in Tianjin[J]. Chin J Radiol Med Prot, 2023, 43(12): 997-1002. DOI:10.3760/cma.j.cn112271-20230426-00131 |
| [4] |
王强, 付强, 林琳. 胸部CT扫描所致儿童癌症风险估算研究[J]. 中华放射医学与防护杂志, 2018, 38(8): 607-611. Wang Q, Fu Q, Lin L. Cancer risk estimation in paedistric chest CT examination[J]. Chin J Radiol Med Prot, 2018, 38(8): 607-611. DOI:10.3760/cma.j.issn.0254-5098.2018.08.009 |
| [5] |
United Nations Scientific Committee on the Effects of Atomic Radiation. UNSCEAR 2020/2021 report. Valuation of medical exposures to ionizing radiation[R]. New York: UNSCEAR, 2022.
|
| [6] |
Mathews JD, Forsythe AV, Brady Z, et al. Cancer risk in 680, 000 people exposed to computed tomography scans in childhood or adolescence: Data linkage study of 11 million Australians[J]. BMJ, 2013, 346: f2360. DOI:10.1136/bmj.f2360 |
| [7] |
李鹏, 张圆圆, 张雨, 等. 石家庄市11家医疗机构CT受检者辐射剂量调查与分析[J]. 中国辐射卫生, 2023, 32(3): 328-334. Li P, Zhang YY, Zhang Y, et al. Investigation and analysis of radiation doses to CT examinees in 11 medical institutions in Shijiazhuang[J]. Chin J Radiol Health, 2023, 32(3): 328-334. DOI:10.13491/j.issn.1004-714X.2023.03.020 |
| [8] |
郭大伟, 罗英男, 高艳辉, 等. 儿童胸部CT辐射剂量调查[J]. 中国辐射卫生, 2024, 29(3): 232-235. Guo DW, Luo YN, Gao YH, et al. Investigation of CT radiation dose in chest of children[J]. Chin J Radiol Health, 2024, 29(3): 232-235. DOI:10.13491/j.issn.1004-714X.2024.03.008 |
| [9] |
国家卫生健康委员会. WS/T 851-2025 X射线计算机体层成像儿童诊断参考水平[S]. 北京: 中国标准出版社, 2025. National Health Commission of the People's Republic of China. WS/T 851-2025 Standard of diagnostic reference levels for pediatric X-ray computed tomography[S]. Beijing: Standards Press of China, 2025. |
| [10] |
孙记航, 段晓岷, 于彤, 等. 儿童CT扫描辐射剂量现状调查和诊断参考水平的初步探讨[J]. 中华放射学杂志, 2022, 56(10): 6. Sun JH, Duan XM, Yu T, et al. Investigation of radiation dose and diagnostic reference levels in CT scanning for children[J]. Chin J Radiol, 2022, 56(10): 6. DOI:10.3760/cma.j.cn112149-20220214-00115 |
| [11] |
高通, 王小山, 马娅, 等. 儿童CT检查诊断参考水平研究进展[J]. 中国辐射卫生, 2024, 33(2): 215-220. Gao T, Wang XS, Ma Y, et al. Research progress on the diagnostic reference level of CT examination in children[J]. Chin J Radiol Health, 2024, 33(2): 215-220. DOI:10.13491/j.issn.1004-714X.2024.02.019 |
| [12] |
中华医学会儿科学分会影像学组, 中华医学会放射学分会儿科学组. 儿童CT检查辐射剂量标准中国专家共识[J]. 中华放射学杂志, 2024, 58(2): 158-164. Radiology Group of Chinese Pediatrics Society of Chinese Medical Association, Pediatrics group of Chinese Society of Radiology of Chinese Medical Association. Expert consensus on radiation dose of children CT examination[J]. Chin J Radiol, 2024, 58(2): 158-164. DOI:10.3760/cma.j.cn112149-20231013-00291 |
| [13] |
邱海静, 高知玲, 贾晶, 等. 宁夏儿童头颅、胸部CT辐射剂量状况分析[J]. 中华放射医学与防护杂志, 2020, 40(44): 851-856. Qiu HJ, Gao ZL, Jia J, et al. Analysis of radiation doses from head and chest CT scanning for children in Ningxia[J]. Chin J Radiol Med Prot, 2020, 40(11): 851-856. DOI:10.3760/cma.j.issn.0254-5098.2020.11.007 |
| [14] |
Xu H, Sun QF, Yue BR, et al. Results and analysis of examination doses for paediatric CT procedures based on a nationwide survey in China[J]. Eur Radiol, 2024, 34(3): 1659-1666. DOI:10.1007/s00330-023-10005-7 |
| [15] |
张见, 杨凤, 王颖, 等. 儿童CT检查诊断参考水平典型值的初步探讨[J]. 中华放射医学与防护杂志, 2023, 43(1): 56-62. Zhang J, Yang F, Wang Y, et al. Preliminary study on the typical values of diagnostic reference level in children's CT examinations[J]. Chin J Radiol Med Prot, 2023, 43(1): 56-62. DOI:10.3760/cma.j.cn112271-20220802-00312 |
| [16] |
温学新, 姚杰, 高林峰, 等. 上海市4家儿童医院的儿童CT剂量分析[J]. 中华放射医学与防护杂志, 2023, 43(2): 124-130. Wen XX, Yao J, Gao LF, et al. Analysis of CT doses to paediatric patients in four children's hospitals in Shanghai[J]. Chin J Radiol Med Prot, 2023, 43(2): 124-130. DOI:10.3760/cma.j.cn112271-20220923-00386 |
| [17] |
Kanda R, Akahane M, Koba Y, et al. Developing diagnostic reference levels in Japan[J]. Jpn J Radiol, 2021, 39(4): 307-314. DOI:10.1007/s11604-020-01066-5 |
| [18] |
Schegerer A, Loose R, Heuser LJ, et al. Diagnostic reference levels for diagnostic and interventional X-ray procedures in Germany: Update and handling[J]. Rofo, 2019, 191(8): 739-751. DOI:10.1055/a-0824-7603 |
| [19] |
Vassileva J, Rehani M, Kostova-Lefterova D, et al. A study to establish international diagnostic reference levels for paediatric computed tomography[J]. Radiat Prot Dosim, 2015, 165(1-4): 70-80. DOI:10.1093/rpd/ncv116 |
| [20] |
Mohammadbeigi A, Khoshgard K, Haghparast A, et al. Local DRLs for paediatric CT examinations based on size-specific dose estimates in Kermanshah, Iran[J]. Radiat Prot Dosim, 2019, 186(4): 496-506. DOI:10.1093/rpd/ncz056 |
| [21] |
Vano E, Miller DL, Martin CJ, et al. ICRP publication 135[J]. Ann ICRP, 2017, 46(1): 1-144. DOI:10.1177/0146645317717209 |
| [22] |
Lira D, Padole A, Kalra MK, et al. Tube potential and CT radiation dose optimization[J]. AJR Am J Roentgenol, 2015, 204(1): W4-W10. DOI:10.2214/AJR.14.13281 |
| [23] |
Malik MMUD, Alqahtani M, Hadadi I, et al. An analysis of computed tomography diagnostic reference levels in India compared to other countries[J]. Diagnostics(Basel), 2024, 14(15): 1585. DOI:10.3390/diagnostics14151585 |
| [24] |
Priyanka, Kadavigere R, Sukumar S, et al. Diagnostic reference levels for computed tomography examinations in pediatric population - A systematic review[J]. J Cancer Res Ther, 2021, 17(4): 845-852. DOI:10.4103/jcrt.JCRT_945_20 |