2. 山东第一医科大学第一附属医院 山东省千佛山医院放射科, 济南 250014
2. Department of Radiology, The First Affiliated Hospital of Shandong First Medical University & Shandong Provincial Qianfoshan Hospital, Jinan 250014, China
近年来,宽体探测器的推出明显提高了Z轴方向上的检测效率和射线利用率,一次旋转就可以完成单器官成像,在临床实践中受到青睐,尤其是在心血管成像方面[1-2]。随着探测器准直宽度的增加,散射线会随着曝光范围的增大而增强,射线剂量会分布不均,可能导致一系列的图像质量问题,所得的图像可能会对分辨率以及噪声方面有所影响[3]。本研究运用体模针对宽体探测器CT的不同扫描方式对空间分辨率、噪声以及辐射剂量的影响进行研究,并且使用imQuest软件进行了客观的评价,以期能为临床应用提供指导作用。
材料与方法1.CT系统和体模:采用320排螺旋CT(上海联影公司,uCT960+)扫描仪,搭载长轴覆盖范围16 cm的320排宽体探测器;美国模体实验室Catphan 500模体(格林威治模体实验室),该模体由4个模块组成,见图 1。CTP404模块用于检测层厚、CT值线性和像素尺寸。CTP528模块用于测量高对比度空间分辨率。CTP515模块用于测量低对比度可探测性。CTP486模块用于评价图像噪声和图像均匀性。

|
注:ROI. 感兴趣区;TTF. 基于任务的传递函数;NPS. 噪声功率谱。图B白色箭头为计算聚乙烯插入物TTF的ROI,代表低对比度的物体,如结节和脂肪;红色箭头为评价特氟纶插入物TTF的ROI,代表高对比度的病变,如钙化;图C红色区域为用于NPS评估的ROI 图 1 Catphan500体模和用于评估基于任务的TTF和噪声功率谱NPS的模块 A. Catphan500体模;B. CTP404模块; C. CTP486模块 Figure 1 Catphan500 phantom and the modules for evaluating task-based transfer function and noise power spectrum A. Catphan500 phantom; B. CTP404 module; C. CTP486 module |
2.扫描方案:使用临床腹部协议分别对Catphan500模体的CTP404和CTP486模块进行扫描,将每个模块置于扫描野的中心位置,通过不同扫描方式对模块进行图像采集。轴扫模式(AX)探测器准直宽度为80、120、140和160 mm,扫描长度等于所选探测器的宽度;螺旋扫描模式(HE)为40和80 mm,扫描螺距选择设定近1∶1,扫描长度均为80 mm。两种扫描模式的管电流分别选择240和100 mAs。其他扫描参数:管电压120 kV,旋转时间1 s,重建层厚1 mm,层间距1 mm,重建算法Karl 3D(5级),重建核B-SOFT-B。
3.图像质量评价:采用imQuest软件对图像质量进行客观评价。它是一款允许以基于任务的传递函数(TTF)来衡量空间分辨率,以噪声功率谱(NPS)来衡量噪声大小和噪声纹理的图像分析软件[4]。
Karl混合迭代重建算法为非线性重建算法,其空间分辨率依赖于图像中的对比度和噪声水平,在CTP404模块中存在不同对比度的圆形插入物(图 1B),可以用于评估这种依赖性。TTF是调制传递函数(MTF)的准线性模拟,强调了系统分辨率受噪声、对象的对比度和径向位置的影响,本实验采用聚乙烯插入物代表低对比度的物体,如结节和脂肪,采用特氟纶插入物代表高对比度的病变,如钙化等。根据Chen等[5]的圆杆方法,从15个连续的层面中提取一个包含低或高对比度插入物的感兴趣区(ROI),从ROI中可以识别圆杆的中心,然后计算ROI中每个像素到中心的距离,HU值与距离的关系构成了边缘扩展函数(ESF)。ESF的导数产生线扩展函数(LSF),LSF的离散傅立叶变换提供TTF。同时标记TTF达到50%(TTF50%)的频率进行评估空间分辨率的变化。
NPS是通过取模体均匀模块的ROI进行傅里叶变换并在整个集合中取平均值得到[6-7]。平面内NPS的评估基于美国医学物理学家协会(AAPM)任务组233中描述的方法[8],并且为了保证稳定性,从均匀性模块的25个连续层面中放置了5个64 × 64像素的方形ROI来提取数据,如图 1C所示。NPS曲线下面积和噪声值用来反映噪声大小[5];NPS峰值频率和平均空间频率来揭示噪声纹理[8],将NPS的总体频率内容描述成:
| $f_{\text {peak }}=argmax[\operatorname{NPS}(f)]$ | (1) |
| $f_{\text {ave }}=\frac{\int f \cdot \operatorname{NPS}(f) d f}{\int \operatorname{NPS}(f) d f}$ | (2) |
式中,f为径向空间频率(mm-1),NPS(f)为径向一维归一化NPS。比较图像的噪声特征:噪声、NPS曲线下面积、NPS峰值频率和平均空间频率。噪声用标准方差(SD)进行表示。
4.辐射剂量:记录每次扫描后自动生成的剂量信息表中的容积CT剂量指数(CTDIvol)。
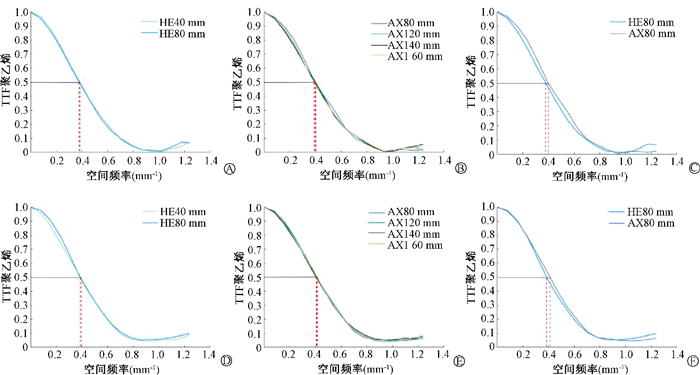
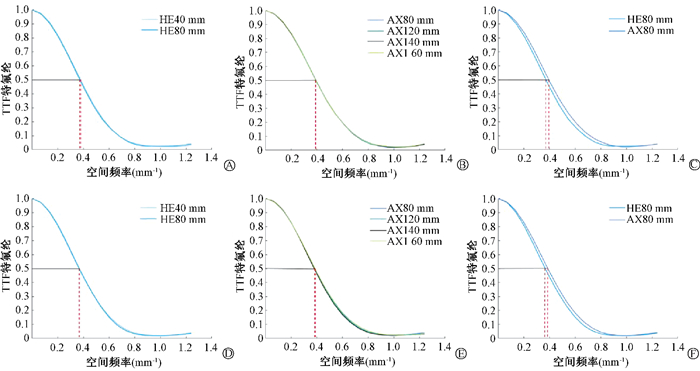
结果1.扫描方式对空间分辨力的影响:图 2、3分别为不同扫描方式下低、高对比度插入物的TTF曲线。对于聚乙烯插入物,相同探测器准直宽度和辐射剂量下轴扫模式的TTF曲线较螺旋扫描模式的略右移,图 2(C、F),表明轴扫模式具有更高的平面内空间分辨率。对于特氟纶插入物,也观察到了相同的趋势,轴扫模式TTF曲线达50%时频率高于螺旋扫描模式的,如图 3(C、F)所示。此外,图 2、3(A、B、D、E)显示相同模式不同准直宽度下的TTF曲线近乎重叠,即图像的空间分辨率受所选准直宽度的影响不大。

|
图 2 低对比插入物-聚乙烯的TTF曲线 A. 100 mAs、螺旋扫描模式、不同探测器准直宽度;B. 100 mAs、轴扫描模式、不同探测器准直宽度;C. 100 mAs、相同探测器准直宽度、不同扫描模式;D. 240 mAs、螺旋扫描模式、不同探测器准直宽度;E. 240 mAs、轴扫描模式、不同探测器准直宽度;F. 240 mAs、相同探测器准直宽度、不同扫描模式 Figure 2 Task-based transfer function (TTF) curve of low-contrast insert -polyethylene A. 100 mAs, helical scan, multiple options of detector collimating width; B. 100 mAs, axial scan, multiple options of detector collimating width; C. 100 mAs, the single option of detector collimating width, different scan modes; D. 240 mAs, helical scan, multiple options of detector collimating width; E. 240 mAs, axial scan, multiple options of detector collimating width; F. 240 mAs, the single option of detector collimating width, different scan modes |

|
图 3 高对比插入物-特氟纶的TTF曲线 A. 100 mAs、螺旋扫描模式、不同探测器准直宽度;B. 100 mAs、轴扫描模式、不同探测器准直宽度;C. 100 mAs、相同探测器准直宽度、不同扫描模式;D. 240 mAs、螺旋扫描模式、不同探测器准直宽度;E. 240 mAs、轴扫描模式、不同探测器准直宽度;F. 240 mAs、相同探测器准直宽度、不同扫描模式 Figure 3 Task-based transfer function (TTF) curve of low-contrast insert - Teflon A. 100 mAs, helical scan, multiple options of detector collimating width; B. 100 mAs, axial scan, multiple options of detector collimating width; C. 100 mAs, single option of detector collimating width, different scan modes; D. 240 mAs, helical scan, multiple options of detector collimating width; E. 240 mAs, axial scan, multiple options of detector collimating width; F. 240 mAs, single option of detector collimating width, different scan modes |
2.扫描方式对噪声大小和纹理的影响:扫描模式和管电流仅改变噪声大小,对噪声纹理无明显影响。不同扫描模式或辐射剂量下NPS峰值和平均空间频率基本无明显变化,而噪声会随着管电流的增加而降低,也会随着螺旋扫描模式改为轴扫模式有所降低,表 1可知相同管电流下轴扫模式的噪声比螺旋扫描降低约14%。此外。不同探测器准直宽度下的噪声值和NPS峰值频率无任何差异,见表 1。与噪声值测量结果趋势一致,轴扫描模式NPS曲线下面积相对于螺旋扫描减少约26%,噪声功率谱曲线下面积列于表 2。
|
|
表 1 不同扫描方式下NPS的相关参数 Table 1 Related parameters of NPS in different scanning methods |
|
|
表 2 不同扫描方式时NPS曲线下面积 Table 2 Area under the NPS curve in different scanning methods |
3.辐射剂量:相同探测器准直宽度下,轴扫模式与螺旋扫描模式的CTDIvol在100 mAs分别为(6.78±0)和(7.76±0.01)mGy,在240 mAs分别为(16.30±0.02)和(18.66±0.03)mGy,与螺旋扫描相比轴扫辐射剂量降低了13%左右。相同扫描模式下,随着准直宽度的增加CTDIvol值有所降低,轴扫模式下当探测器准直宽度增加1倍时CTDIvol约减少9%,见表 3。
|
|
表 3 不同扫描方式容积CT剂量指数CTDIvol值(mGy,x±s) Table 3 CTDIvol values in different scanning methods (mGy, x±s) |
讨论
近年来开发的宽体探测器Z轴最大准直宽度可达16 cm,一次旋转可覆盖单个器官,重新引入了轴扫模式在一系列应用中的可行性,尤其是心脏和头部CT,并且很多研究在临床环境中调查了不同扫描模式下的图像质量[9-12]。Z轴准直宽度的增加意味着锥形束角度增大,加强了阳极效应的表现,导致剂量分布不均[13],继而可能影响图像质量,有研究采用体模对比了探测器不同准直宽度下的图像分辨率[14],但是体模位置相对固定,主观判断可能会存在偏差。本研究采用一种客观的方式系统的比较了不同扫描模式和探测器准直宽度对空间分辨率、噪声和辐射剂量的影响,可以一定程度上避免人的主观影响。
本研究显示螺旋模式辐射剂量相比于轴扫模式增加了约13%,这可能源于为了重建螺旋扫描图像的第一部分和最后部分,需要额外旋转来进行插值,便存在一种过扫描的现象,从而导致辐射剂量增加[15]。结果指出,扫描模式对TTF和NPS有主要影响,由于考虑到测量的不确定性,管电流对TTF和噪声纹理的影响可以忽略不计。轴扫模式可以采集目标组织360°的真实的物理数据信息进行重建,而螺旋扫描不能采集每一层面中的全部数据,是利用插值算法填补采集中缺失的数据,因此导致图像质量有一定的下降。前面从图像质量和辐射剂量方面均显示轴扫模式优于螺旋扫描模式,但是由于锥形光束几何形状原因,轴扫模式两端图像的视野有限,其中以160 mm探测器最为显著,两侧分别约4.5 mm长度不能全扫描野重建。
探测器不同准直宽度的TTF 50%以及NPS峰值和平均空间频率数值均无明显差异,意味着不同准直宽度的图像质量是相似的,原因可能在于阳极效应导致的剂量差值主要表现在扫描野两端[16],而本探究是扫描野中心位置的图像质量,射线剂量相对稳定,另外噪声的纹理高度依赖于重建过程中所使用的卷积核和重建算法[6],故而不同准直宽度的图像质量无明显差异。随着准直宽度的增加Z轴射线利用率越高,160 mm探测器的射线利用率可达96.6%[9],所以辐射剂量CTDIvol随着准直宽度的增加而有所降低。
本研究还存在着一定的局限性:主要对比了联影CT u960+设备的图像质量,未探讨其他机型或开发商设备的图像质量,有研究表明不同机型的图像质量和辐射剂量会有所不同[17-18]。研究仅对体模进行扫描评价,在临床中对人体扫描部位的影响程度有待进一步探讨。本研究只讨论扫描模式和探测器准直宽度,没有涉及其他扫描参数,如螺距、层厚、层间距、重建核等,临床操作中应综合考虑各种因素的影响。
综上所述,本研究表明使用宽体探测器CT单次扫描时,不同的扫描方式对图像质量和辐射剂量具有一定的影响,尤其是扫描模式。总之在临床上应该根据扫描部位以及诊断要求选择适合的扫描模式和探测器准直宽度。
利益冲突 所有作者均声明不存在利益冲突
作者贡献声明 亓慧负责设计实验、数据分析和论文撰写;崔丁也负责实验操作以及数据获取;李伟负责研究设计、论文修改、审核
| [1] |
严诚, 周琳夕, 周国锋, 等. 320排探测器CT单心动周期扫描应用于心律不齐患者冠状动脉成像的可行性[J]. 中国临床医学, 2021, 28(2): 236-240. Yan C, Zhou LX, Zhou GF, et al. Feasibility of single cardiac cycle 320 detector CT scan in patients with arrhythmia undergoing coronary angiography[J]. Chin J Clin Med, 2021, 28(2): 236-240. DOI:10.12025/j.issn.1008-6358.2021.20210100 |
| [2] |
尹乐康, 严诚, 陆怡菡, 等. 国产新型320排CT冠状动脉成像的初步应用研究及图像质量评价[J]. 中国临床医学, 2021, 28(6): 1035-1039. Yin LK, Yan C, Lu YH, et al. Application and image quality evaluation of new domestic 320-slice CT in coronary artery imaging[J]. Chin J Clin Med, 2021, 28(6): 1035-1039. DOI:10.12025/j.issn.1008-6358.2021.20211025 |
| [3] |
Jeon PH, Lee CL. Improving image quality by optimizing beam width and helical pitch in CT[J]. J Xray Sci Technol, 2022, 30(2): 399-408. DOI:10.3233/XST-211103 |
| [4] |
Wilson JM, Christianson OI, Richard S, et al. A methodology for image quality evaluation of advanced CT systems[J]. Med Phys, 2013, 40(3): 031908. DOI:10.1118/1.4791645 |
| [5] |
Chen B, Christianson O, Wilson JM, et al. Assessment of volumetric noise and resolution performance for linear and nonlinear CT reconstruction methods[J]. Med Phys, 2014, 41(7): 071909. DOI:10.1118/1.4881519 |
| [6] |
Solomon JB, Christianson O, Samei E. Quantitative comparison of noise texture across CT scanners from different manufacturers[J]. Med Phys, 2012, 39(10): 6048-6055. DOI:10.1118/1.4752209 |
| [7] |
Franck C, Zhang G, Deak P, et al. Preserving image texture while reducing radiation dose with a deep learning image reconstruction algorithm in chest CT: A phantom study[J]. Phys Med, 2021, 81: 86-93. DOI:10.1016/j.ejmp.2020.12.005 |
| [8] |
Samei E, Bakalyar D, Boedeker KL, et al. Performance evaluation of computed tomography systems: Summary of AAPM Task Group 233[J]. Med Phys, 2019, 46(11): e735-e756. DOI:10.1002/mp.13763 |
| [9] |
刘晓怡, 綦维维, 刘卓, 等. 头颅CT不同扫描方式的图像质量分析[J]. 中国医学影像学杂志, 2017, 25(6): 418-421. Liu XY, Qi WW, Liu Z, et al. Image quality assessment of brain CT with different scanning modes[J]. Chin J Med Imaging, 2017, 25(6): 418-421. DOI:10.3969/j.issn.1005-5185.2017.06.005 |
| [10] |
李杨, 庄勋慧, 李伟凯, 等. 宽体探测器CT儿童头部不同扫描模式对辐射剂量及图像质量影响的研究[J]. 中国医疗设备, 2020, 35(4): 65-67, 78. Li Y, Zhuang XH, Li WK, et al. Effects of different scanning patterns on radiation dose and image quality in routine head CT of children with wide-detector CT[J]. J Chin Med Dev, 2020, 35(4): 65-67, 78. DOI:10.3969/j.issn.1674-1633.2020.04.017 |
| [11] |
Hlaihel C, Boussel L, Cochet H, et al. Dose and image quality comparison between prospectively gated axial and retrospectively gated helical coronary CT angiography[J]. Br J Radiol, 2011, 84(997): 51-57. DOI:10.1259/bjr/13222537 |
| [12] |
Bischoff B, Hein F, Meyer T, et al. Comparison of sequential and helical scanning for radiation dose and image quality: results of the prospective multicenter study on radiation dose estimates of cardiac CT angiography (PROTECTION) Ⅰ study[J]. AJR Am J Roentgenol, 2010, 194(6): 1495-1499. DOI:10.2214/AJR.09.3543 |
| [13] |
Braun H, Kyriakou Y, Kachelriess M, et al. The influence of the heel effect in cone-beam computed tomography: artifacts in standard and novel geometries and their correction[J]. Phys Med Biol, 2010, 55(19): 6005-6021. DOI:10.1088/0031-9155/55/19/024 |
| [14] |
郭森林, 任悦, 张永县, 等. 宽体探测器CT探测器组合对影像分辨力影响的实验研究[J]. 中华放射医学与防护杂志, 2022, 42(5): 396-399. Guo SL, Ren Y, Zhang YX, et al. The experimental study of the effect of detector combination on image resolution in wide-detector CT[J]. Chin J Radiol Med Prot, 2022, 42(5): 396-399. DOI:10.3760/cma.j.cn112271-20220217-00058 |
| [15] |
Kroft LJ, Roelofs JJ, Geleijns J. Scan time and patient dose for thoracic imaging in neonates and small children using axial volumetric 320-detector row CT compared to helical 64-, 32-, and 16- detector row CT acquisitions[J]. Pediatr Radiol, 2010, 40(3): 294-300. DOI:10.1007/s00247-009-1436-x |
| [16] |
Schilham A, van der Molen AJ, Prokop M, et al. Overranging at multisection CT: an underestimated source of excess radiation exposure[J]. Radiographics, 2010, 30(4): 1057-1067. DOI:10.1148/rg.304095167 |
| [17] |
Hara T, Niwa S, Urikura A, et al. Assessment of longitudinal beam property and contrast uniformity for 256- and 320-row area detector computed tomography scanners in the 160-mm nonhelical volume-acquisition mode[J]. J Appl Clin Med Phys, 2019, 20(8): 164-170. DOI:10.1002/acm2.12670 |
| [18] |
Lambert JW, Phillips ED, Villanueva-Meyer JE, et al. Axial or helical? Considerations for wide collimation CT scanners capable of volumetric imaging in both modes[J]. Med Phys, 2017, 44(11): 5718-5725. DOI:10.1002/mp.12525 |
 2024, Vol. 44


