2. 天津市疾病预防控制中心职业病预防控制室,天津 300011;
3. 重庆市疾病预防控制中心,重庆 400042;
4. 广东省职业病防治院,广州 510300;
5. 天津医科大学肿瘤医院放射科 国家肿瘤临床医学研究中心 天津市肿瘤防治重点实验室 天津市恶性肿瘤临床医学研究中心 乳腺癌防治教育部重点实验室,天津 300060
2. Institute of Occupational Disease Control and Prevention, Tianjin Center for Disease Control and Prevention, Tianjin 300011, China;
3. Chongqing Center for Disease Control and Prevention, Chongqing 400042, China;
4. Guangdong Province Hospital for Occupational Disease Prevention and Treatment, Guangzhou 510300, China;
5. Department of Radiology, Tianjin Medical University Cancer Institute and Hospital, National Clinical Research Center of Cancer, Tianjin Key Laboratory of Cancer Prevention and Therapy, Tianjin′s Clinical Research Center for Cancer, Key Laboratory of Breast Cancer Prevention and Therapy, Tianjin 300060, China
2020年,全球女性乳腺癌发病率首次超过肺癌,成为威胁女性健康的第一大癌症[1]。在乳腺癌的筛查和诊断过程中,乳腺X射线摄影(mammography,MG)发挥了重要作用[2-3]。近年来,乳腺锥形束CT(CBCT)作为新的三维MG技术被应用于临床并表现出良好的应用价值[4]。然而,乳房腺体组织易受辐射影响,乳腺X射线检查所产生的低剂量辐射具有潜在的癌症诱发风险[5]。为做好患者防护,国际社会普遍开展了MG受检者的剂量水平研究[6-7]。我国的卫生行业标准WS 76-2020[8]中针对MG所规定的乳腺压迫模型以及WS 818-2023标准[9]中针对乳腺CBCT所规定的乳腺非压迫模型均参考了欧美国家的标准,但以往研究表明,我国女性乳房密度及尺寸与欧美女性存在差异[10]。清华大学的研究团队曾根据我国女性乳房特征开发了乳腺精细模型[11],并估算了用于患者剂量评估的剂量转换因子,其结果显著高于国际上普遍采用的Dance等[12]的剂量转换因子,说明建立我国女性乳腺剂量学模型的重要性。但国内针对女性群体乳腺密度及相关乳房特征的定量研究较少,且多基于二维MG图像展开[11, 13-15],检查时,受迫乳房内的腺体组织在成像方向上会发生重叠,从而造成测量结果存在偏差[16]。乳腺CBCT在扫描时不压迫乳房,更能反映受检乳房内腺体分布的真实情况[17]。因此,本研究旨在利用多个地区乳腺CBCT女性受检者的三维影像资料,描述和分析我国女性的乳房特征及其分布规律,从而进一步完善我国乳腺CBCT受检者剂量评估方法。
材料与方法 1、设备信息利用天津科宁医疗设备有限公司乳腺CBCT阅片系统Imaging Viewer(1.6.0和1.6.0.6.6.8),调取并分析患者的图像资料。图像均由科宁生产的KBCT-1000乳腺CBCT成像系统进行拍摄。
2、患者资料目前国内仅有6家医院将乳腺CBCT设备用于临床检查,本研究根据设备的使用频次和地域分布情况选择了天津、重庆、广州的3家医院开展调查,能在一定程度上反映我国华北,西南和华南地区女性的乳房特征。共回顾性调查了1 440例患者的三维影像资料,每位患者仅调查了健康侧乳房的平扫图像。排除图像信息不完整者、乳腺相关癌症史者、乳房手术史者及假体植入史者。
3、测量方法本研究为描述性研究,图像分析沿用了前期研究[18]所使用的半自动化计算机辅助测量法,测量指标包括胸壁有效直径(effective diameter of the breast at chest-wall,Deff)、胸壁-乳头距离(chest-wall to nipple length,CNL)、乳房体积(breast volume,BV)、腺体体积(glandular volume,GV)和乳腺体积密度(volumetric breast density,VBD)。将调查对象按地区和年龄分组,描述我国女性乳腺体积密度及相关乳房特征的总体及其在地区和年龄间的分布情况。并进一步分析各项乳房特征与年龄之间,以及不同乳房特征之间的关系。
4、统计学处理采用SPSS 26.0软件进行数据分析,OriginPro 2021软件进行绘图。经Shapiro-Wilk检验,所调查的各项计数资料均不服从正态分布,数据以中位数M和第25、75百分位数(P25,P75)描述。各年龄段乳房特征分布的比较采用Kruskal-Wallis H检验,后续两两比较使用Bonferroni校正法。各项乳房特征与年龄,乳腺体积密度与乳房尺寸特征之间的相关关系通过Spearman相关系数来分析。P<0.05为差异有统计学意义。
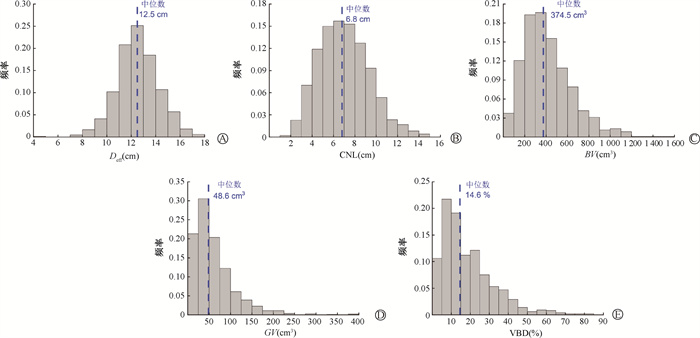
结果 1、总体乳房特征本研究共调查了1 440例乳腺CBCT平扫图像,左侧740例、右侧700例,调查对象年龄范围为19~84岁,中位数为49岁。图 1和表 1分别显示了受检女性乳房特征的总体分布情况和详细调查结果。

|
注:Deff. 胸壁有效直径;CNL. 胸壁-乳头距离;BV. 乳房体积;GV. 腺体体积;VBD. 乳腺体积密度 图 1 受检者乳房特征总体分布情况 A. Deff; B. CNL; C. BV; D. GV; E. VBD Figure 1 Overall distribution of the examinees′ breast characteristics A. Deff; B. CNL; C. BV; D. GV; E. VBD |
|
|
表 1 受检者总体乳房特征调查结果 Table 1 Overall breast characteristics of examined dividuals |
2、女性乳房特征地区分布
本研究分别调查了天津某医院1 023例,重庆某医院203例以及广州某医院214例(分别位于我国华北、西南和华南地区)乳腺CBCT的图像,3家医院被调查对象的年龄中位数(范围)分别为49(19~84)岁、50(19~80)岁、46(20~83)岁。表 2列出了不同地区医院受检女性乳房特征的分布情况,3个地区医院女性乳房的Deff、CNL、BV、GV差异均有统计学意义(H = 10.67~43.33,P<0.01),VBD在3个地区医院的分布差异无统计学意义(P>0.05)。
|
|
表 2 不同地区医院女性受检者乳房特征[M(P25, P75)] Table 2 Results of examined individuals′ breast characteristics in different regions[M(P25, P75)] |
3、女性乳房特征年龄分布
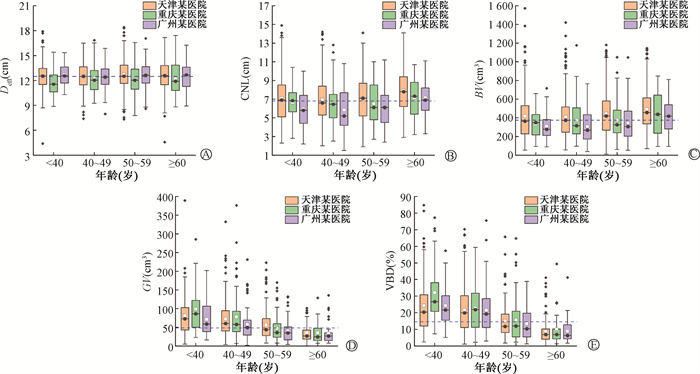
将调查对象按年龄分布分为40岁以下(n=238)、40~49岁(n=518)、50~59岁(n=412)、60岁及以上(n=272) 4组,分析女性乳房特征在不同年龄段的分布情况及其受年龄因素的影响。表 3中列出了不同年龄段女性乳房特征调查结果,CNL、BV、GV、VBD在4个年龄的分布差异均有统计学意义(H = 38.97~230.16,P<0.01),而各年龄段Deff差异无统计学意义(P>0.05)。进一步两两比较发现,60岁以上年龄组女性受检乳房的CNL和BV与其他3组差异有统计学意义(H = -198.60~-118.26,P<0.01);GV和VBD在40岁以下年龄组和40~49岁年龄组之间差异无统计学意义(P>0.05),在其他3组之间的分布差异均具有统计学意义(H = 135.84~397.61,P<0.001)。图 2显示了受检女性乳房特征在不同年龄段的分布情况,随着年龄段的上升,各地区受检女性乳房CNL、BV存在上升趋势,GV、VBD存在下降趋势。相关分析结果显示,GV和VBD与年龄均呈显著负相关(r=-0.41、-0.49,P<0.001),CNL和BV提与年龄均呈显著正相关(r = 0.14、0.16,P<0.001),但相关性较弱。
|
|
表 3 不同年龄段女性受检者乳房特征分布[M(P25, P75)] Table 3 Results of examined individuals’breast characteristics in different age groups[M(P25, P75)] |

|
注:Deff. 胸壁有效直径;CNL. 胸壁-乳头距离;BV. 乳房体积;VBD. 乳腺体积密度;图中箱体表示上下四分位数范围;箱体中的白色方块为均数,黑色圆点为中位数;黑色菱形方块为异常值;蓝色虚线表示被调查群体各乳房特征的总体中位数水平 图 2 不同年龄段女性乳房特征分布 A. Deff; B. CNL; C. BV; D. GV; E. VBD Figure 2 Distribution of female breast characteristics in different age groups A. Deff; B. CNL; C. BV; D. GV; E. VBD |
4、腺体体积密度与乳房尺寸的关联
乳腺体积密度VBD与乳房尺寸特征Deff、CNL和BV均存在显著负相关(r=-0.42、-0.24、-40,P<0.001)。进一步将调查对象按乳房尺寸特征分别分段,分别拟合了不同组段下所对应的VBD均值与Deff、CNL和BV均值的线性关系(图 3),随乳房尺寸增加,乳腺体积密度呈下降趋势,与相关分析结果较一致。

|
注:Deff. 胸壁有效直径;CNL. 胸壁-乳头距离;BV. 乳房体积;VBD. 乳腺体积密度 图 3 乳腺体积密度与不同乳房尺寸特征的线性关系 A. VBD与Deff; B. VBD与CNL; C. VBD与BV Figure 3 Linear relationship between volumetric breast density and different breast size characteristics A. VBD and Deff; B. VBD and CNL; C. VBD and BV |
5、国内外不同研究中女性乳房特征比较
表 4中列举了部分国内外女性乳房特征研究的调查结果[13, 19-21]。
|
|
表 4 不同研究中女性乳房特征调查结果(x± s) Table 4 Results of female breast characteristics in different studies(x± s) |
讨论
准确了解女性乳房特征是开展X射线相关的乳房影像学检查中受检者辐射剂量评估研究的基础。我国的全国乳腺剂量调查[7]和质量控制规范[8]中所使用的MG受检者乳腺平均剂量的估算方法均基于简单乳房模型[22]。这种简单模型以MG图像为基础,对乳房的解剖学特征进行了简化和假设,在进行对比、优化、质量控制等研究时,可以反映不同情况下乳腺平均剂量的大小关系,但不足以反映X射线在受检者乳房中的实际分布和吸收情况[23]。随着三维乳腺专用CT的出现,更加真实的乳房解剖学特征得以被认识[20-21, 24]。Yaffe等[21]调查发现,女性乳房中腺体组织在整个乳房中的体积百分数平均为19.3%,且被调查群体中95%的女性腺体体积百分含量均<45%,说明“50%/50%”的乳房并不是典型的妇女乳房组份。随后,乳腺体积密度以及乳房内腺体组织的空间分布情况逐渐受到关注,以乳腺专用CT图像所反映的乳房特征为基础,一些复杂的乳腺模体和数字化模型被开发并应用于受检者辐射剂量评估[25-27]。目前国内有限的乳腺体积密度研究还停留在二维层面,均提示我国女性乳房VBD集中在20%以下[13-15],但如前文所述,基于二维图像开展的乳房特征测量存在一定的误差。本研究则以三维乳腺CBCT图像为基础,所使用的基于阈值分割的乳房特征定量测量方法在以往研究[21, 28]中被证实具有较高的准确性和可靠性。
此外,本研究还同时调查了乳腺CBCT临床受检者的典型扫描参数,94.0%以上检查的管电流为50 mA,少数为64 mA(4.1%)、80 mA(0.9%)、100 mA(0.3%)和125 mA(0.1%),对应了120~300 mAs的管电流时间积,管电压为49 kV的固定值。与二维MG(管电流中位数55 mAs、管电压中位数28 kV)[7]相比,具有更高的典型扫描参数,同样说明了开展乳腺CBCT受检者乳房特征调查并进一步开展受检者剂量评估研究的重要性。
本研究中,被调查者Deff、CNL、BV、GV和VBD的总体平均水平分别为12.5 cm、6.8 cm、374.5 cm3、48.6 cm3和14.6%。其中,不同地区女性的Deff、CNL和BV显著不同,综合来看,主要表现为华北地区女性乳房尺寸大于华南/西南地区女性乳房,可能由于华北地区女性的体质量指数(BMI)平均水平高于西南和华南地区人群[29],以往研究表明BMI与乳房腺体密度存在负相关关系[30]。本研究中VBD在不同地区的差异不具有统计学意义,但从数值来看,位于南方的两家医院调查结果更高。在调查乳房特征的年龄分布时发现,不同年龄组中CNL、BV、GV和VBD的分布不同,CNL和BV有随年龄增高而增高的趋势,总体来说乳房尺寸特征在60岁以上显著增加,而GV和VBD有随着受检者年龄的增加而降低的趋势,在50岁以上显著降低,可能与不同年龄段女性的新陈代谢能力、体内激素水平的变化有关[31-32]。本研究显示VBD与尺寸相关的Deff、CNL和BV均呈显著负相关关系,与以往研究结果一致[20-21, 24]。
在Vedantham等[20]基于137例患者乳腺CT图像的研究中,各项乳房特征呈偏态分布。其Deff、PNL(相当于本研究中的CNL)和BV略高于本研究结果,VBD比本研究结果略低。虽然以往有研究表明亚洲女性乳房偏小且致密[10],但两群体差异不明显,其原因可能在于Vedantham等[20]的研究为小样本的单中心研究,不足以代表大范围群体。本研究中BV的均值为374.5 cm3,远小于Yaffe等[21]研究结果,其研究所得BV的均值为769 cm3,但VBD偏大,提示不同国家女性乳房大小和密度存在差异。本研究结果与王佳豪等[13]基于1 140例二维MG图像的研究结果存在一定差异,其BV和VBD的总体平均水平分别为491.8 cm3和14.6%,两项研究的VBD接近,但本研究BV明显低于王佳豪等[13]的研究,其原因一方面可能在于基于二维图像所测得的乳房体积是计算机算法根据乳房模型得到的估算值,与实际情况存在偏差;另一方面在前者研究中使用了Volpara软件对图像进行批量分析,在分析时未对乳房范围进行划分,其中包含的大量侧斜位图像中所涵盖的腋窝及胸大肌等部位未被剔除,从而导致总体BV偏高。而在刘爱迪等[19]同样基于乳腺CBCT的小样本研究中,其VBD的中位数为14.4%~15.9%。总体来说,本研究所得乳腺体积密度及相关乳房特征与以往研究较一致。
乳房密度的定量研究不仅可以用于乳腺剂量学模型的开发,还有助于乳腺癌筛查方案的优化。一方面高乳腺密度是乳腺癌发病的危险因素[33-35];另一方面,高密度乳房腺体组织对病灶的遮掩效应更大[36],不利于疾病的检出,同时可能会因受到更大剂量的电离辐射而进一步诱发乳腺癌的发生。因此,有学者认为以MG为主的筛查方案不适用于乳腺密度高的人群[37]。自2009年至今,美国一半以上的州均陆续建立了乳腺密度报告的法案[38],要求在进行乳腺X射线检查时,需向受检者告知其乳腺密度及其可能对诊断造成的影响,同时针对不同乳腺密度特点制定个性化的筛查方案。而国内缺乏对一般人群腺体密度特点的个体检查和群体筛查建议。
综上,本研究对位于我国3个不同地区装有乳腺CBCT设备的医院开展了妇女乳房特征的定量研究,一定程度上反映了我国妇女乳房的一般特征,可为建立适应于我国女性的乳房剂量模型提供数据基础,为针对性地开展乳腺剂量测量、乳腺癌风险评估和制定筛查方案的提供依据。但本研究存在一定的局限性,由于国内乳腺CBCT设备装机较少且装机时间较短,数据局限于几家医院,且在各医院选取的样本量的不同可能造成一定程度的选择偏倚。未来可对位于更丰富的临床数据进行调查,以准确把握我国女性乳房特征从而优化包括二维、三维在内的患者乳腺剂量学模型,从而进一步优化乳腺X射线受检者的剂量评估方法,做好受检者的辐射防护。
利益冲突 无
志谢 感谢科宁(天津)医疗设备有限公司提供的支持和帮助
作者贡献声明 薛珂负责现场测量,数据整理、分析和论文撰写及修改;徐辉负责研究设计,指导论文撰写与审核;岳保荣、丁艳秋参与研究设计和论文修改;牛振、杨云福、谭展参与数据收集;叶兆祥参与指导现场调查和论文修改
| [1] |
Sung H, Ferlay J, Siegel RL, et al. Global cancer statistics 2020: GLOBOCAN estimates of incidence and mortality worldwide for 36 cancers in 185 countries[J]. CA Cancer J Clin, 2021, 71(3): 209-249. DOI:10.3322/caac.21660 |
| [2] |
Ren W, Chen M, Qiao Y, et al. Global guidelines for breast cancer screening: A systematic review[J]. Breast, 2022, 64: 85-99. DOI:10.1016/j.breast.2022.04.003 |
| [3] |
赫捷, 陈万青, 李霓, 等. 中国女性乳腺癌筛查与早诊早治指南(2021, 北京)[J]. 中华肿瘤杂志, 2021, 43(4): 357-382. He J, Chen WQ, Li N, et al. China guideline for the screening and early detection of female breast cancer (2021, Beijing)[J]. Chin J Oncol, 2021, 43(4): 357-382. DOI:10.3760/cma.j.cn112152-20210119-00061 |
| [4] |
Zhu Y, O'Connell AM, Ma Y, et al. Dedicated breast CT: state of the art-Part Ⅱ. Clinical application and future outlook[J]. Eur Radiol, 2022, 32(4): 2286-2300. DOI:10.1007/s00330-021-08178-0 |
| [5] |
Miglioretti DL, Lange J, van den Broek JJ, et al. Radiation-induced breast cancer incidence and mortality from digital mammography screening: a modeling study[J]. Ann Intern Med, 2016, 164(4): 205-214. DOI:10.7326/M15-1241 |
| [6] |
Liu Q, Suleiman ME, McEntee MF, et al. Diagnostic reference levels in digital mammography: a systematic review[J]. J Radiol Prot, 2022, 42(1): 011503. DOI:10.1088/1361-6498/ac4214 |
| [7] |
徐辉, 岳保荣, 尉可道, 等. 我国乳腺X射线摄影受检者乳腺剂量水平调查研究[J]. 中国辐射卫生, 2016, 25(6): 641-644. Xu H, Yue BR, Wei KD, et al. Research on glandular dose level of mammography in China[J]. Chin J Radiol Health, 2016, 25(6): 641-644. DOI:10.13491/j.cnki.issn.1004-714x.2016.06.001 |
| [8] |
国家卫生健康委员会. WS 76-2020医用X射线诊断设备质量控制检测规范[S]. 北京: 中国标准出版社, 2020. National Health Commission of the People's Republic of China. WS 76-2020 Specification for testing of quality control in medical X-ray diagnostic equipment[S]. Beijing: Standards Press of China, 2020. |
| [9] |
国家卫生健康委员会. WS 818-2023锥形束X射线计算机体层成像(CBCT)设备质量控制检测标准[S]. 北京: 中国标准出版社, 2023. National Health Commission of the People's Republic of China. WS 818-2023 Standard for testing of quality control in X-ray cone beam computed tomography equipment[S]. Beijing: Standards Press of China, 2020. |
| [10] |
del Carmen MG, Halpern EF, Kopans DB, et al. Mammographic breast density and race[J]. AJR Am J Roentgenol, 2007, 188(4): 1147-1150. DOI:10.2214/AJR.06.0619 |
| [11] |
Wang W, Qiu R, Ren L, et al. Monte Carlo calculation of conversion coefficients for dose estimation in mammography based on a 3D detailed breast model[J]. Med Phys, 2017, 44(6): 2503-2514. DOI:10.1002/mp.12210 |
| [12] |
Dance DR, Young KC, van Engen RE. Further factors for the estimation of mean glandular dose using the United Kingdom, European and IAEA breast dosimetry protocols[J]. Phys Med Biol, 2009, 54(14): 4361-4372. DOI:10.1088/0031-9155/54/14/002 |
| [13] |
王佳豪, 邱睿, 胡安康, 等. 女性乳腺体积密度及分布的影像学初步研究[J]. 中华放射医学与防护杂志, 2022, 42(10): 806-811. Wang JH, Qiu R, Hu AK, et al. Preliminary imaging study on the distribution of female volumetric breast density[J]. Chin J Radiol Med Prot, 2022, 42(10): 806-811. DOI:10.3760/cma.j.cn112271-20220527-00229 |
| [14] |
胡从依, 马文娟, 柳杰, 等. 乳腺密度、年龄与乳腺癌发病风险的关系分析[J]. 临床放射学杂志, 2022, 41(11): 4. Hu CY, Ma WJ, Liu J, et al. Relationship between breast density, age and the risk of breast cancer[J]. J Clin Radiol, 2022, 41(11): 4. DOI:10.13437/j.cnki.jcr.2022.11.013 |
| [15] |
王建明, 张晓飞, 刘慧. Quantra体积密度软件与乳腺影像报告和数据系统分型评估乳腺X线密度一致性分析[J]. 实用医技杂志, 2022, 29(7): 677-680. Wang JM, Zhang XF, Liu H. Consistency in breast density on mammography as assessed by Quantra breast volumetric density software vs breast imaging reporting and data system classification[J]. J Pract Med Tech, 2022, 29(7): 677-680. DOI:10.19522/j.cnki.1671-5098.2022.07.001 |
| [16] |
Alonzo-Proulx O, Mawdsley GE, Patrie JT, et al. Reliability of automated breast density measurements[J]. Radiology, 2015, 275(2): 366-376. DOI:10.1148/radiol.15141686 |
| [17] |
Zhu Y, O'Connell AM, Ma Y, et al. Dedicated breast CT: state of the art-Part Ⅰ. Historical evolution and technical aspects[J]. Eur Radiol, 2022, 32(3): 1579-1589. DOI:10.1007/s00330-021-08179-z |
| [18] |
薛珂, 徐辉, 岳保荣, 等. 基于三维影像的我国女性乳房特征初步调查[J]. 中国辐射卫生, 2023, 32(6): 618-625. Xue K, Xu H, Yue BR, et al. A preliminary survey of female breast characteristics based on three-dimensional images of breast cone-beam computed tomography[J]. Chin J Radiol Health, 2023, 32(6): 618-625. DOI:10.13491/j.issn.1004-714X.2023.06.004 |
| [19] |
刘爱迪, 叶兆祥, 马悦, 等. 基于锥光束乳腺CT测量乳腺密度的可靠性研究[J]. 中国肿瘤临床, 2018, 45(5): 246-250. Liu AD, Ye ZX, Ma Y, et al. Reliability of breast density estimation based on cone beam breast CT[J]. Chin J Clin Oncol, 2018, 45(5): 246-250. DOI:10.3969/j.issn.1000-8179.2018.05.167 |
| [20] |
Vedantham S, Shi L, Karellas A, et al. Dedicated breast CT: fibroglandular volume measurements in a diagnostic population[J]. Med Phys, 2012, 39(12): 7317-7328. DOI:10.1118/1.4765050 |
| [21] |
Yaffe MJ, Boone JM, Packard N, et al. The myth of the 50-50 breast[J]. Med Phys, 2009, 36(12): 5437-5443. DOI:10.1118/1.3250863 |
| [22] |
Hammerstein GR, Miller DW, White DR, et al. Absorbed radiation dose in mammography[J]. Radiology, 1979, 130(2): 485-491. DOI:10.1148/130.2.485 |
| [23] |
Dance DR, Sechopoulos I. Dosimetry in X-ray-based breast imaging[J]. Phys Med Biol, 2016, 61(19): R271-R304. DOI:10.1088/0031-9155/61/19/R271 |
| [24] |
Huang SY, Boone JM, Yang K, et al. The characterization of breast anatomical metrics using dedicated breast CT[J]. Med Phys, 2011, 38(4): 2180-2191. DOI:10.1118/1.3567147 |
| [25] |
Sechopoulos I, Bliznakova K, Qin X, et al. Characterization of the homogeneous tissue mixture approximation in breast imaging dosimetry[J]. Med Phys, 2012, 39(8): 5050-5059. DOI:10.1118/1.4737025 |
| [26] |
Sarno A, Mettivier G, Tucciariello RM, et al. Monte Carlo evaluation of glandular dose in cone-beam X-ray computed tomography dedicated to the breast: Homogeneous and heterogeneous breast models[J]. Phys Med, 2018, 51: 99-107. DOI:10.1016/j.ejmp.2018.05.021 |
| [27] |
Hernandez AM, Becker AE, Boone JM. Updated breast CT dose coefficients (DgN(CT)) using patient-derived breast shapes and heterogeneous fibroglandular distributions[J]. Med Phys, 2019, 46(3): 1455-1466. DOI:10.1002/mp.13391 |
| [28] |
Liu A, Yin L, Ma Y, et al. Quantitative breast density measurement based on three-dimensional images: a study on cone-beam breast computed tomography[J]. Acta Radiol, 2022, 63(8): 1023-1031. DOI:10.1177/02841851211027386 |
| [29] |
吴超群, 李希, 路甲鹏, 等. 中国居民心血管疾病危险因素分布报告[J]. 中国循环杂志, 2021, 36(1): 10. Wu CQ, Li X, Lu JP, et al. Report on geographical disparity of cardiovascular risk factors in China[J]. Chin J Circulation, 2021, 36(1): 10. DOI:10.3969/j.issn.1000-3614 |
| [30] |
闫晔. 中国女性乳腺腺体密度分布及其影响因素的研究[D]. 天津: 天津医科大学, 2014. Yan Y. Distribution of mammographic density and its influential factors among Chinese women[D]. Tianjin: Tianjin Medical University, 2014. |
| [31] |
Hannan FM, Elajnaf T, Vandenberg LN, et al. Hormonal regulation of mammary gland development and lactation[J]. Nat Rev Endocrinol, 2023, 19(1): 46-61. DOI:10.1038/s41574-022-00742-y |
| [32] |
Gabrielson M, Azam S, Hardell E, et al. Hormonal determinants of mammographic density and density change[J]. Breast Cancer Res, 2020, 22(1): 95. DOI:10.1186/s13058-020-01332-4 |
| [33] |
Kataoka M. Mammographic density for personalized breast cancer risk[J]. Radiology, 2023, 306(2): e222129. DOI:10.1148/radiol.222129 |
| [34] |
Boyd NF, Guo H, Martin LJ, et al. Mammographic density and the risk and detection of breast cancer[J]. N Engl J Med, 2007, 356(3): 227-236. DOI:10.1056/NEJMoa062790 |
| [35] |
Yaghjyan L, Colditz GA, Rosner B, et al. Mammographic breast density and breast cancer risk by menopausal status, postmenopausal hormone use and a family history of breast cancer[J]. Cancer Causes Control, 2012, 23(5): 785-790. DOI:10.1007/s10552-012-9936-7 |
| [36] |
Holland K, van Gils CH, Mann RM, et al. Quantification of masking risk in screening mammography with volumetric breast density maps[J]. Breast Cancer Res Treat, 2017, 162(3): 541-548. DOI:10.1007/s10549-017-4137-4 |
| [37] |
Edmonds CE, O'Brien SR, Conant EF. Mammographic breast density: current assessment methods, clinical implications, and future directions[J]. Semin Ultrasound CT MR, 2023, 44(1): 35-45. DOI:10.1053/j.sult.2022.11.001 |
| [38] |
Conant EF, Sprague BL, Kontos D. Beyond BI-RADs density: a call for quantification in the breast imaging clinic[J]. Radiology, 2018, 286(2): 401-404. DOI:10.1148/radiol.2017170644 |
 2024, Vol. 44


