 2015, Vol. 35


2. Department of Computational Physics, Institute of Modrn Physics, Chinese Academy of Sciences, Lanzhou
Normally,cells exposed to ionizing radiation (IR) are blocked at a certain cell cycle phase,which is thought to be caused by the generation of DNA double-strand breaks (DSBs) and forced cells to initiate DNA repair prior to the next round of cell division[1, 2]. G1 and G2 arrest following exposure to radiation are widely reported in recent years[3, 4]. In our previous studies,prolonged G2 arrest was observed besides classical G1 arrest after X-ray or heavy-ion irradiation of a melanoma cell line 92-1[5, 6]. The underlying mechanism for long-term G2 arrest is assumed to be the degradation of cyclin B1,an important cell-cycle checkpoint factor. After extended periods of cell cycle arrest,the vast majority of cells eventually become senescent[7, 8, 9]. These findings provide a solid experimental correlation between cell cycle block with cellular radio-sensitivity,which enhances the importance of cell cycle process.
Many models have been developed to describe the dynamical behavior of cell populations[10, 11, 12, 13, 14]. Some of them have the characteristics of good expansibility[15]. Liu et al[16] and Dawson et al[17] constructed a mathematical model to investigate how the stimulus influenced the cell cycle distribution. Brown et al[18] developed a simulation method to analyze the cell cycle distribution using flow cytometric data. In addition,several population models were used to study the dynamics of the irradiated tumor cells and the various cell fates have been considered[19, 20, 21, 22]. However,there are few studies focusing on the cell cycle progress following ionizing radiation and the relevant experimental data are lacking. In the present study,a computational model was developed by designing a phenomenological system,which is consistent with our experimental data. The results should provide a first step to more precise prediction of the cell status following exposure to ionizing radiation[23, 24].
Human choroidal malignant melanoma 92-1 cells were cultured in RPMI 1640 medium (Sigma,USA) complemented with 10% fetal bovine serum (FBS,USA),100 g/ml streptomycin,and 100 U/ml penicillin in a humidified atmosphere of 5% CO2. Cells were seeded in 12-well plates 2 d before irradiation,and grown to <70% confluence at the time of irradiation. Cells were exposed to X-rays (100 kV,5 mA,no additional filter; Faxitron RX650,USA) at room temperature and a dose rate of 1 Gy/min.
2.Cell synchronizationFor cell synchronization,92-1 cells were grown in medium containing 1 mmol/L thymidine (Sigma,USA) for 24 h without delay irradiation.
3.Cell cycle assayCells were harvested and fixed with 70% pre-chilled ethanol for at least 24 h at -20 ℃. Prior to analysis,fixed cells were washed twice with PBS,centrifuged at 300×g for 5 min,treated with 100 g/ml. RNase A and 50 g/ml propidium iodide (BD Biosciences,UAS) for 30 min at 37℃,and analyzed by FACS calibur flow cytometry (Becton Dickinson,USA). DNA content was measured with CellQuest (Becton Dickinson,USA) and cell cycle distribution was analyzed by FlowJo software.
4. Simulation conditionsA cell-cycle model with three phases is proposed,G0/G1 phase,S phase,G2 phase and M phase. The duration of each phase is assumed to obey Gaussian distribution. In our model,there were N variables Sn (n=1…N) represented the cell cycle phase of N different cells. Their value Sn=0,1,2,3means that the cell n was in S,G2,M or G1 phase,respectively. For the nth cell,four random numbers (tn0,tn1,tn2,tn3) are created to describe the duration of S,G2,M and G1 phase of the cell. These random numbers obey fixed Gaussian distribution. Because of the efficiency of synchronization in the actual experiments was not ideal,the synchronized cells were not actually synchronized at exactly the same time-point in cell cycle duration even though their cell cycle measured with flow cytometry seemed to be at the same phase. Thus,another random number tn is created to represent the time-point in the cell cycle of cell n in simulations. According to the experimental data (the proportions of cell phases at time point 0 h),the time-point tn of one cell in the cell cycle prior to irradiation is also supposed to obey Gaussian distribution.
DSBs induced by ionizing radiation have to be widely repaired[25]. In the simulation,the numbers of DSBs and other DNA lesions for each cell should obey a Poisson distribution and the mean of this distribution should be proportional to the radiation intensity[26]. If the repair of same DNA lesions costs cell the same time to complete,the total recovery time for one cell trepair will obey a Poisson distribution,too. It is demonstrable that lager dose radiation could cost cells more time to repair. Although the kinetics of DSB repair follows a double exponential curve[27] and seems to be independent of radiation intensity after exposed to low-dose radiation[28],the repair time of the cells pretreated with drug after exposure to low-dose radiation seems to be proportional to radiation intensity reversely[29]. Moreover,besides the DSB,the kinetics of other DNA lesions repair follows a linear curve[30]. The relation between repair time and radiation intensity is still not clear[31],especially after the moderate-dose and high-dose radiations. Here we assumed that expectation of trepair should be proportional to radiation intensity (trepair∝dose) and the average recovery time was supposed as trepair(h)=2×radiation intensity(dose). Thus,when cell n suffers radiation,a random number tnrepair,which obeys a poisson distribution,will be created to describe the duration of DNA repair. Based on our previous results,melanoma 92-1 cells are blocked in G2 phase by ionizing radiation[9]. The mean and variance of the distribution are proportional to the irradiation dose. For one cell,two unique thresholds (Tr1,Tr2) are defined: if tnrepair<Tr1,the cell will completely repair the radiation-induced damage; if Tr1<tnrepair<Tr2,the cell can pass the G2 checkpoint but will be blocked at the following G1 checkpoint; and if Tr2<tnrepair,there will be a prolonged G2 arrest for this cell. The G1 checkpoint is set at 2 h before the end of G1 phase. A completely repaired cell will come back to normal cell cycle and have a division capacity at M phase. In this model,when the cell divides into two cells,the daughter cells will have the same duration of each phase as mother cell.
Insimulations N=300,and parameters are shown in Table 1. For cell n,tn in simulation correspond to tn h. One time step was set as 0.01 h. That is,in the simulation process of our model we let tn+0.01→tn after one time step to present growth of cell n. Totally 10 000 time steps are taken for simulation. Figure 1 showed the pseudo code and detailed simulation rules.
| Table 1 Parameters used in our simulations. Average durations of cell-cycle phases were empirical and the variations of them were assumed. Two thresholds were assumed based on the experimental data |

 | Figure 1 Pseudo code of model |
In order to give a qualitative explanation for the cell cycle dynamics,a theoretical model is constructed to explain the long-time asymptotic behaviors of cells that suffered from IR. If the cell death is neglected,three ordinary differential equations (ODEs) are written to describe the dynamics of cell cycle as following[22]:

In order to obtain the cell cycle dynamics of the cells in difference phases,92-1 cells were synchronized in late G1 phase and exposed to various doses of X-rays immediately after release and then their cell cycle distribution was monitored with flow cytometry up to 96 h.
Although 80% cells were synchronized at the later G1 phase,only 10% cells remained in G1 phase 6 h later after release no matter that cells were exposed to ionizing radiation or not (Figure 2). Within the time range of the experiments (0-96 h),the proportion G0/G1 phase cells in the whole cell populations at normal condition displayed an oscillation at 48 h after release from thymidine treatment and then reached to a stable phase. 24 h later after exposure to 2 Gy of radiation,about 80% cells returned to G1 phase and remained unchanged then. Upon exposure to 5 Gy of radiation,only about 30% cells returned to G1 phase. No cells returned to G1 phase after exposed to 10 and 15 Gy of radiation.
 | Figure 2 Dynamics of cell cycle distributions at different doses A. Dynamics of G1 phase distributions; B. Dynamics of S phase distributions; C. Dynamics of G2/M phase distributions |
No matter irradiated or not,all cell populations exhibited a peak in S phase 6 h after cell cycle release (Figure 2). Cells without irradiation displayed a second peak at 36 h after release,while those cells who were exposed to radiation displayed a low proportion of S phase cells without any obvious peak.
As shown in Figure 2,no cells were found in G2/M phase after synchronization. However,the proportion of G2/M phase cells increased right after release. For control cells,G2/M phase cells reached to a peak of 35% 6 h after release and then decreased to less than 10%. However,it increased again 24 h later and reached to another peak at 36 h after release.After 2 Gy irradiation cells,the proportion of G2/M phase cells reached to a peak of 50% and then decreased gradually to less than 10%. For 5 Gy irradiation,the proportion of G2/M phase cells reached to a higher peak but decreased slightly. After 10 or 15 Gy irradiation cells,the proportion of G2/M phase cells reached to a peak as high as 75% and remained no changed during subsequent culture.
Obviously,cells without irradiation entered S phase and G2/M phase right after release. X-ray radiation blocked cells in G2/M phase in a dose-dependent manner. If the irradiation dose was low,a small percentage of cells returned to the G1 phase. However,when the dose was over 10 Gy,the majority of the cells were arrested in a prolonged G2 phase. These results were consistent with our previous studies.
2. Simulation of cell cycle dynamics after synchronized cells were exposed to various doses of radiationIn the simulations,the comparisons between simulation results and experimental data were shown in Figure 3. The degree of fitting was calculated to test the effectiveness of this model. Table 2 showed that there was a consistency between simulation results and experimental data at 0 and 2 Gy. As the irradiation doses were increased,the proportion of S phase cells between simulation results and experimental data showed difference and the amount of proportion of S phase cells was about 10% after 24 h while in simulation results,it closed to zero. It implied that a slight S phase arrest might exist in high-dose irradiated cells,which had not been considered in our model.
 | Figure 3 Comparison between simulation results and experimental data at different doses A. 0 Gy; B. 2 Gy; C. 5 Gy; D. 10 Gy |
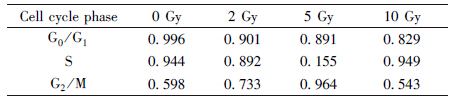
| Table 2 The degree of fitting between simulation results and experimental data for different cell phases at different doses,the formula used here is R2=1-|SST-SSE|/SST,SST was total sum of squares,SSE was error sum of squares |
The influence of parameters (Tr1,Tr2) was studied on the proportion of prolonged G2-arrested cells after radiation. The variations of the proportion of prolonged G2-arrested cells with different Tr1 and radiation doses were given when the cells are supposed to be ideally synchronized between G1 and S phases (Figure 4). Tr1 was connected with cellular radio-sensitivity of cells. If cells had a higher Tr1,the proportion of prolonged G2-arrested cells would be 0. If the radiation dose was increased,there would be more prolonged arrested cells and the proportion would reach to 1. 92-1 cells are very radiosensitive,so Tr1 for them is small. In our model the value was given as 1 h.
 | Figure 4 Influences of parameters in phenomenological model and theoretical model A. Heat map of proportion of prolonged G2-arrested cells with different Tr1 and radiation intensity; B. Heat map of ln(G01/G2M) with different parameters a and c |
From the Eq.(1-3),the asymptotic behavior of G01/G2M when time t tends to infinity (t→∞) can be analytically given by

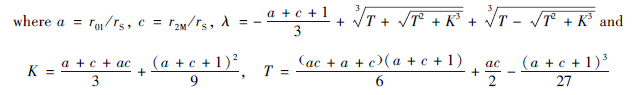
Then the values of G01/G2M was estimated at 96 h after radiation based on the experimental data. From the heat map,the estimated values of our parameters a and c at different doses of radiation are obtained.
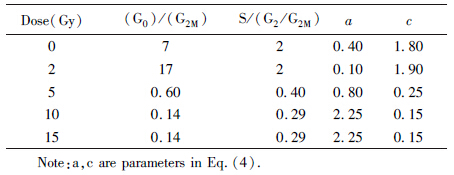
[LL] When dose was null,the parameters a and c were obtained from normal cell cycle. When dose was 2 Gy,parameter c did not change while a dropped to a small number (see in Table 3),which means a strong G1 arrest. When the dose ascended,parameter c was falling,which means a strong G2 arrest.
| Table 3 Parameters in the theoretical model |
Several mathematical tools were designed to depict the dynamics of cell phase curves[32, 33, 34]. Enderling et al[35] had developed a model for tumor survival after radiotherapy. Ochab-Marcinek et al[36] reported a model to discuss the influence of radiations on cell-cycle delay. But a theoretical model for cells containing cell-cycle arrest and DNA repair process has not been established yet. The dynamics of radiation-induced cell-cycle arrest and DNA repair process was obscure and hard to use a group of simple differential equations to be described. So,it was difficult to get analytic solutions for these cell behaviors[37]. A phenomenological simulation is a good alternative tool. As the results shown in this study,the simulations semi-quantitatively fit experimental data if proper parameters were chosen. Because of tumor cell lines vary in radiosensitivity and DNA repair capacity,our next goal is to verify its feasibility of this model in describing the dynamics of other types of human cell lines.
In our previous studies,different melanoma cell lines showed different radio-tolerance and response after IR-irradiation . In this study,92-1 cell line was chosen,which showed a prolonged G2 block after a high dose ionizing radiation. The proportions of every cell phase at several time-points were measured. Some cells pass G2 arrest,but they were still blocked at G1 checkpoint,especially when the dose was less than 5 Gy. G1 checkpoint was more stringent than G2 checkpoint[38]. Cells undergoing incomplete DNA damage repair might pass the G2 checkpoint and be blocked again at G1 checkpoint,thus express a cell cycle suspension. This phenomenon was considered in our models. Our simulation results were consistent with the experimental data would support this point in reverse. In other papers,cells treated with drugs could be stopped at G1 or G2 checkpoints with a probability closed to 1[23],which is similar in proportion to high-intensity irradiation in our experiments.
Although synchronized cells were used in this work,this method could also be extended to simulate cell populations in any distribution of cell cycle. If there were other repair modes such as mismatch repair in cells,the duration of repair must be rewritten to a complex mode. Several publications had shown that there are differences between ionizing radiation and ultraviolet radiation from DNA repair mode to molecular response[39, 40]. Next step,we will develop our phenomenological model to describe cell behaviors after exposure to other radiation types such as ultraviolet exposure.
A phenomenological model was constructed in this paper,which could be used to describe the dynamics of cell cycle of cells exposed to ionizing radiation and was supported by the experimental data. Our model could be used to predict dynamics of cell cycle of different cells exposed to a certain irradiation dose. Because this model is easy to run by written code,it has a good expansibility for studying the behaviors of cell populations under various conditions.
| [1] | Jazayeri A, Falck J, Lukas C, et al. ATM- and cell cycle-dependent regulation of ATR in response to DNA double-strand breaks[J]. Nat Cell Biol, 2006, 8(1): 37-45. |
| [2] | Agarwal ML, Agarwal A, Taylor WR, et al. p53 controls both the G2/M and the G1 cell cycle checkpoints and mediates reversible growth arrest in human fibroblasts[J]. Proc Natl Acad Sci USA, 1995, 92(18): 8493-8497. |
| [3] | Tarasov V, Jung P, Verdoodt B, et al. Differential regulation of microRNAs by p53 revealed by massively parallel sequencing: miR-34a is a p53 target that induces apoptosis and G1-arrest[J]. Cell Cycle, 2007, 6(13): 1586-1593. |
| [4] | Bunz F, Dutriaux A, Lengauer C, et al. Requirement for p53 and p21 to sustain G2 arrest after DNA damage[J]. Science, 1998, 282(5393): 1497-1501. |
| [5] | He J, Li J, Ye C, et al. Cell cycle suspension: a novel process lurking in G2 arrest[J]. Cell Cycle, 2011, 10(9): 1468-1476. |
| [6] | Wang F, Bing Z, Zhang Y, et al. Quantitative proteomic analysis for radiation-induced cell cycle suspension in 92-1 melanoma cell line[J]. J Radiat Res, 2013, 54(4): 649-662. |
| [7] | Leontieva OV, Gudkov AV, Blagosklonny MV. Weak p53 permits senescence during cell cycle arrest[J]. Cell Cycle, 2010, 9(21): 4323-4327. |
| [8] | Demidenko ZN, Blagosklonny MV. Growth stimulation leads to cellular senescence when the cell cycle is blocked[J]. Cell Cycle, 2008, 7(21): 3355-3361. |
| [9] | Ye C, Zhang X, Wan J, et al. Radiation-induced cellular senescence results from a slippage of long-term G2 arrested cells into G1 phase[J]. Cell Cycle, 2013, 12(9): 1424-1432. |
| [10] | Basse B, Ubezio P. A generalised age- and phase-structured model of human tumour cell populations both unperturbed and exposed to a range of cancer therapies[J]. Bull Math Biol, 2007, 69(5): 1673-1690. |
| [11] | Hirt BV, Wattis JA, Preston SP, et al. The effects of a telomere destabilizing agent on cancer cell-cycle dynamics-integrated modelling and experiments[J]. J Theor Biol, 2012, 295: 9-22. |
| [12] | Basse B, Baguley BC, Marshall ES, et al. A mathematical model for analysis of the cell cycle in cell lines derived from human tumors[J]. J Math Biol, 2003, 47(4): 295-312. |
| [13] | Basse B, Baguley BC, Marshall ES, et al. Modelling cell population growth with applications to cancer therapy in human tumour cell lines[J]. Prog Biophys Mol Biol, 2004, 85(2-3): 353-368. |
| [14] | Daukste L, Basse B, Baguley BC, et al. Mathematical determination of cell population doubling times for multiple cell lines[J]. Bull Math Biol, 2012, 74(10): 2510-2534. |
| [15] | Hillen T, de Vries G, Gong J, et al. From cell population models to tumor control probability: including cell cycle effects[J]. Acta Oncol, 2010, 49(8): 1315-1323. |
| [16] | Liu W, Hillen T, Freedman HI. A mathematical model for M phase specific chemotherapy including the G0 phase and immunoresponse[J]. Math Biosci Eng, 2007, 4(2): 239-259. |
| [17] | Dawson A, Hillen T. Derivation of the tumour control probability (TCP) from a cell cycle model[J]. Comput Math Method M, 2006, 7(2-3): 121-141. |
| [18] | Brown MR, Summers HD, Rees P, et al. Flow-based cytometric analysis of cell cycle via simulated cell populations[J]. PLoS Comput Biol, 2010, 6(4): e1000741. |
| [19] | Scheidegger S, Fuchs HU, Zaugg K, et al. Using state variables to model the response of tumour cells to radiation and heat: A novel multi-hit-repair approach[J]. Comput Math Method M, 2013, 2013: 587543. |
| [20] | Hardenbergh PH, Hahnfeldt P, Hlatky L, et al. Distinct mathematical behavior of apoptotic versus non-apoptotic tumor cell death[J]. Int J Radiat Oncol Biol Phys, 1999, 43(3): 601-605. |
| [21] | Lohse I, Lang S, Hrbacek J, et al. Effect of high dose per pulse flattening filter-free beams on cancer cell survival[J]. Radiother Oncol, 2011, 101(1): 226-232. |
| [22] | Jeffries CD, Johnson CR, Zhou T, et al. A flexible and qualitatively stable model for cell cycle dynamics including DNA damage effects[J]. Gene Regul Syst Biol, 2012, 6: 55-66. |
| [23] | Ubezio P, Lupi M, Branduardi D, et al. Quantitative assessment of the complex dynamics of G1, S, and G2-M checkpoint activities[J]. Cancer Res, 2009, 69(12): 5234-5240. |
| [24] | Basse B, Baguley BC, Marshall ES, et al. Modelling cell death in human tumour cell lines exposed to the anticancer drug paclitaxel[J]. J Math Biol, 2004, 49(4): 329-357. |
| [25] | Wyman C, Kanaar R. DNA double-strand break repair: all's well that ends well[J]. Annu Rev Genet, 2006, 40: 363-383. |
| [26] | Singh SK, Wu W, Wang M, et al. Extensive repair of DNA double-strand breaks in cells deficient in the DNA-PK-dependent pathway of NHEJ after exclusion of heat-labile sites[J]. Radiat Res, 2009, 172(2): 152-164. |
| [27] | Stenerl246;w B, H246;glund E, Carlsson J, et al. Rejoining of DNA fragments produced by radiations of different linear energy transfer[J]. Int J Radiat Biol, 2000, 76(4): 549-557. |
| [28] | B246;cker W, Iliakis G. Computational methods for analysis of foci: validation for radiation-induced γ-H2AX foci in human cells[J]. Radiat Res, 2006, 165(1): 113-124. |
| [29] | Jagetia GC, Venkatesha VA. Mangiferin protects human peripheral blood lymphocytes against γ-radiation-induced DNA strand breaks: a fluorescence analysis of DNA unwinding assay[J]. Nutr Res, 2006, 26(6): 303-311. |
| [30] | Holt SM, Scemama JL, Panayiotidis MI, et al. Compromised repair of clustered DNA damage in the human acute lymphoblastic leukemia MSH2-deficient NALM-6 cells[J]. Mutat Res, 2009, 674(1-2): 123-130. |
| [31] | O'Rourke SF, McAneney H, Hillen T. Linear quadratic and tumour control probability modelling in external beam radiotherapy[J]. J Math Biol, 2009, 58(4-5): 799-817. |
| [32] | Braun RD, Bissig D, North R, et al. Human tumor cell proliferation evaluated using manganese-enhanced MRI[J]. PLoS One, 2012, 7(2): e30572. |
| [33] | Titz B, Jeraj R. An imaging-based tumour growth and treatment response model: investigating the effect of tumour oxygenation on radiation therapy response[J]. Phys Med Biol, 2008, 53(17): 4471-4488. |
| [34] | Orlando DA, Lin CY, Bernard A, et al. A probabilistic model for cell cycle distributions in synchrony experiments[J]. Cell Cycle, 2007, 6(4): 478-488. |
| [35] | Enderling H, Chaplain MA, Hahnfeldt P. Quantitative modeling of tumor dynamics and radiotherapy[J]. Acta Biotheor, 2010, 58(4): 341-353. |
| [36] | Ochab-Marcinek A, Gudowska-Nowak E, Nasonova E, et al. Modeling radiation-induced cell cycle delays[J]. Radiat Environ Biophys, 2009, 48(4): 361-370. |
| [37] | Mayhew MB, Robinson JW, Jung B, et al. A generalized model for multi-marker analysis of cell cycle progression in synchrony experiments[J]. Bioinformatics, 2011, 27(13): i295-303. |
| [38] | Deckbar D, Jeggo PA, L246;brich M. Understanding the limitations of radiation-induced cell cycle checkpoints[J]. Crit Rev Biochem Mol Biol, 2011, 46(4): 271-283. |
| [39] | Purvis JE, Lahav G. Encoding and decoding cellular information through signaling dynamics[J]. Cell, 2013, 152(5): 945-956. |
| [40] | Nocentini S. Rejoining kinetics of DNA single- and double-strand breaks in normal and DNA ligase-deficient cells after exposure to ultraviolet C and γ-radiation: an evaluation of ligating activities involved in different DNA repair processes[J]. Radiat Res, 1999, 151(4): 423-432. |